Case study 02 · Fruiting Forecast
A field planner for
where to look next.
A regional mushroom-fruiting planner for the lower 48. It turns weather, habitat, soils, terrain, and recent observations into explained opportunity scores, with separate access information to help plan a search. It forecasts conditions, not mushroom identity.
- Type
- Regional fruiting-opportunity planner
- Live at
- fruitingforecast.com
- Coverage
- Lower 48 states, 13 regional profiles
- Scope
- Product, data pipeline, front end
- Status
- Live, models labeled provisional
01 / The question
Where is it worth looking this week?
Season, weather, habitat, and access all matter, and most of the advice available is either a vague calendar or a spot someone else found last year. A forager with two free hours needs a ranked answer for the ground within driving distance.
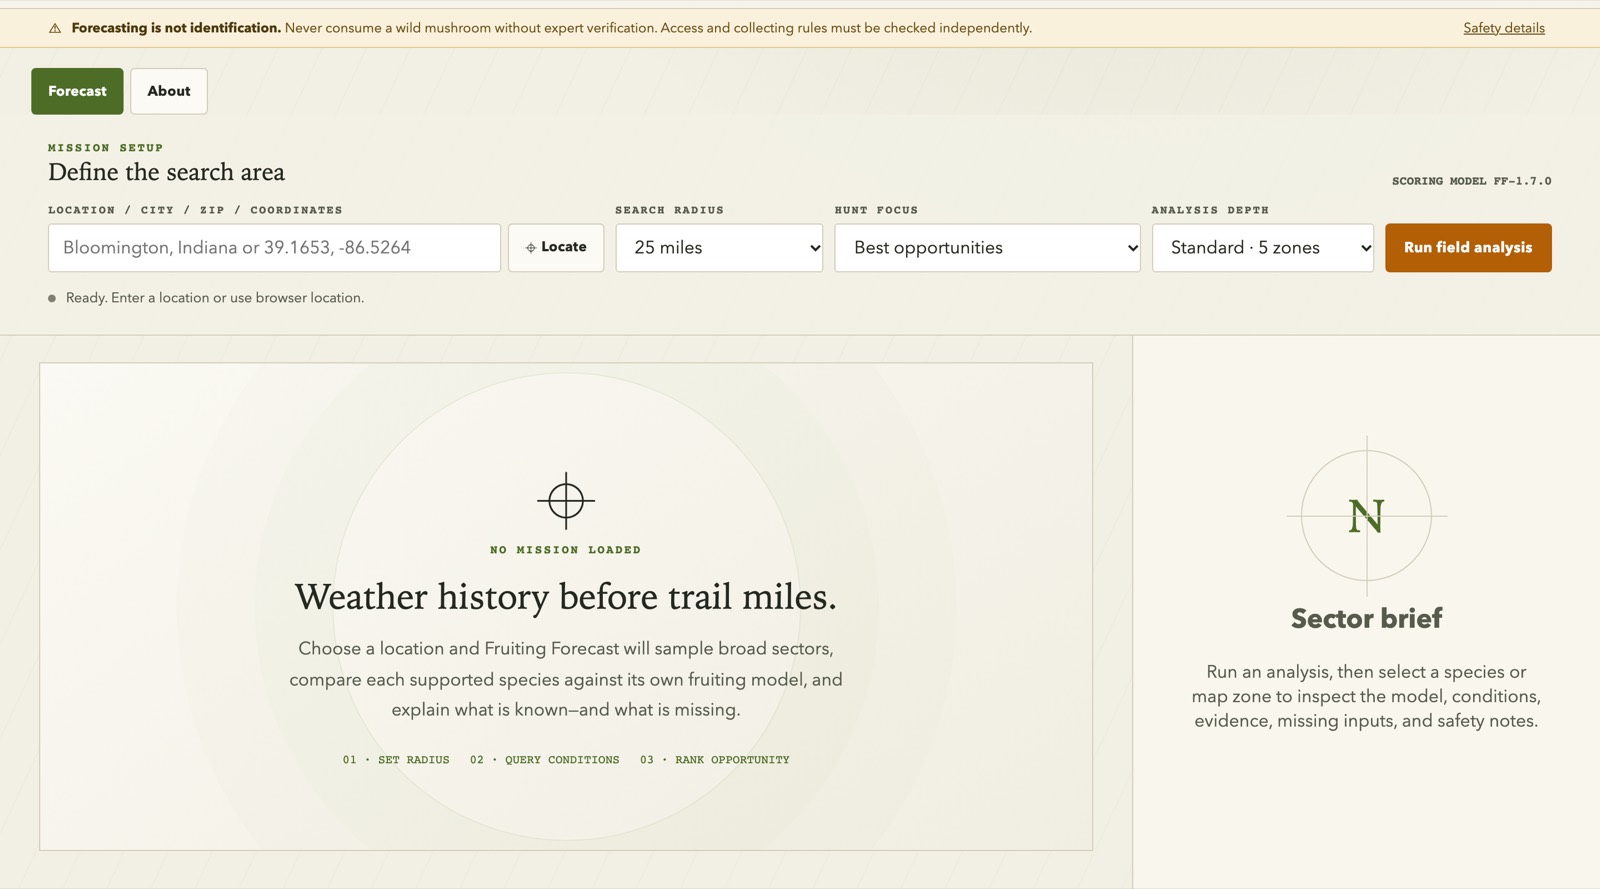
Fruiting Forecast asks for a location, a radius, and an analysis depth. It samples broad sectors, compares every supported species against its own fruiting model, and explains what is known—and what is missing.
02 / What goes in
Conditions, not folklore.
The model is regional on purpose. A single national rule would be simpler to build and wrong more often, so the input set is broad and every layer carries its own provenance and evidence status.
- 01Weather history and recent rain
- 02Seasonal fruiting windows
- 03Habitat, forest type, and host species
- 04Canopy and land cover
- 05Soils and modeled ground moisture
- 06Terrain and elevation
- 07Fire history and public-land access
- 08Recent observations
03 / By design
The score is arithmetic, not a language model.
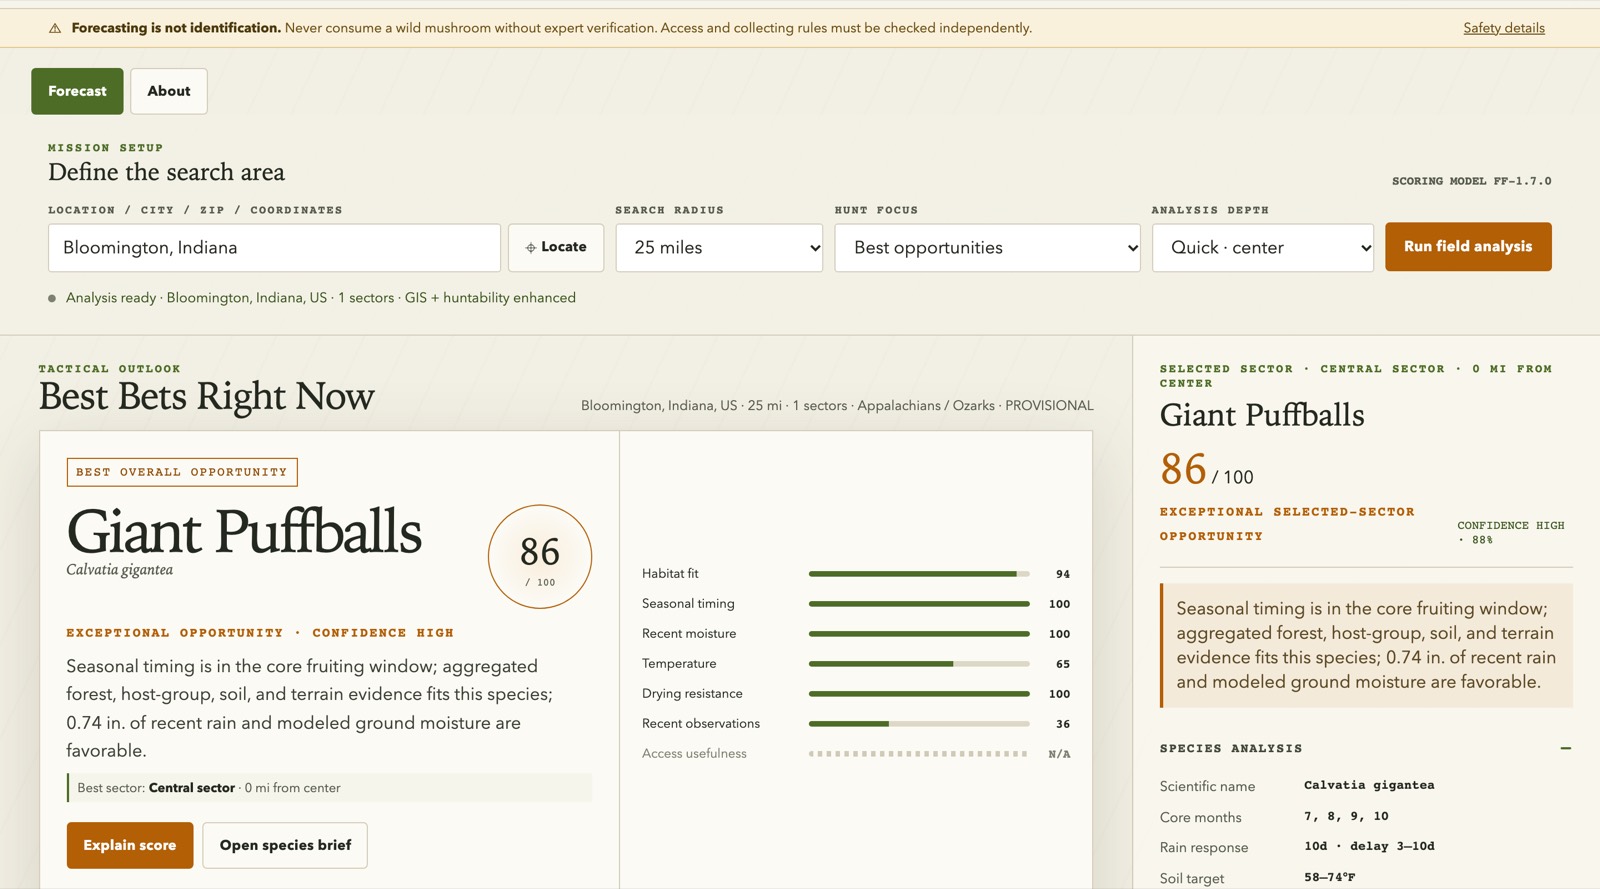
Every opportunity is a weighted score from a fixed, versioned model. The result screen shows the inputs behind it: habitat fit, seasonal timing, moisture, temperature, drying resistance, and observation evidence, each scored separately.
In the example below, seasonal timing and moisture contribute strongly to the Giant Puffball score of 86 out of 100. Weaker observation evidence remains visible. The score is a model output, not a probability of finding mushrooms; access and collecting permission are assessed separately. Optional AI interpretation can explain a result; it never replaces the score.
04 / The limits
Forecasting is not identification.
The safety banner sits at the top of every screen, not in a footer. It says plainly that the app forecasts opportunity, that no wild mushroom should be eaten without expert verification, and that access and collecting rules have to be checked independently.
The biology is labeled the same way. Of the 13 regional profiles, 11 are marked provisional and two are marked model-sparse. National mapped coverage is published alongside the caveat that coverage is not proof of species presence or of scientific validation.
A score describes modeled opportunity. It does not say a mushroom is there, that it is edible, or that you may take it.
Saying that out loud made the product more useful, not less.
05 / On a phone
The setup fits a phone; the evidence stays legible.
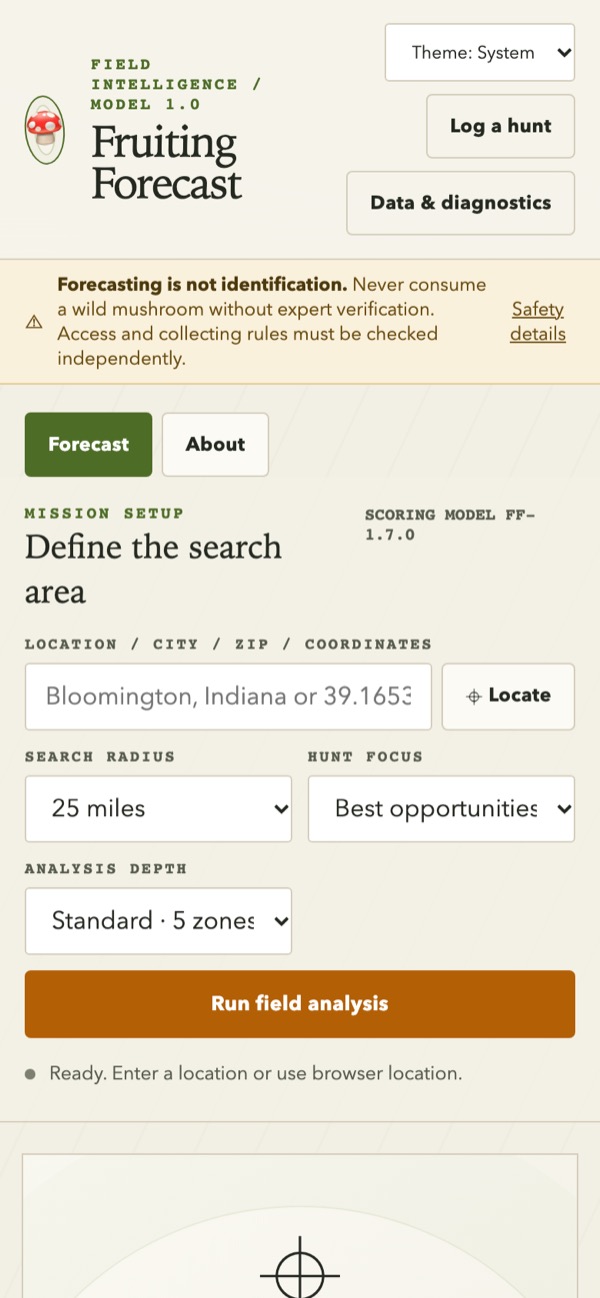
The setup form collapses into one column without hiding a control or shrinking a tap target. The safety banner stays at the top, and the model version stays visible next to the heading it qualifies.
Results keep their labels, scores, and evidence rows in the same order as the desktop version. A narrow screen changes the arrangement, not the argument.
06 / The result
Live, and honest about its coverage.
Fruiting Forecast runs at fruitingforecast.com as static HTML and JavaScript, with DuckDB-Wasm querying immutable Parquet data from an independent origin and IndexedDB holding local records. There is no application server, database server, or bundler in the deployment.
The same approach applies to operational planning and business decision tools: combine scattered data, model the rules of a specific domain, and show why an option ranks higher. Missing inputs and provisional models stay visible so the person using the tool can judge the recommendation.
For your business
Need clearer answers from scattered data?
Tell us about the decision you need to make and the information behind it. We’ll help define a practical next step.